21 Aug 2026
Charting Interconnected Variables in Multi-Table Tournament Poker Dynamics
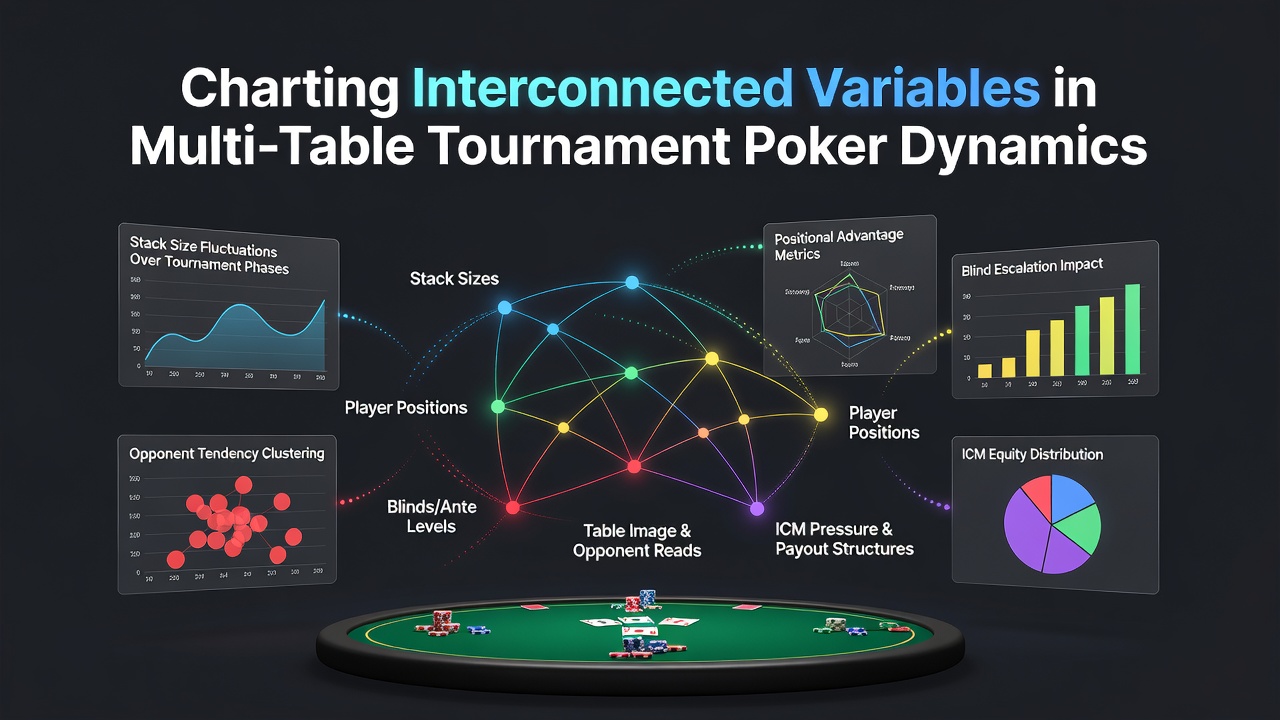
Multi-table tournament poker involves dozens of variables that shift simultaneously, and researchers have documented how these elements connect through observable patterns in large datasets from major events. Stack depth interacts directly with position, while blind levels alter aggression rates across entire fields, according to tracking systems used by professional circuits. Data from tournament databases shows that players who adjust for these overlaps maintain longer survival times on average.
Stack Sizes and Their Ripple Effects
Effective stack sizes determine available move sets, yet they connect tightly to table composition and remaining player counts. When stacks fall below 20 big blinds, raise-fold ranges tighten measurably, while deeper stacks open wider preflop options that depend on position. Studies tracking millions of hands from 2025 events indicate that short-stack clusters at one table increase fold equity for medium stacks elsewhere, creating chain reactions that propagate through the field.
Position Relative to Blinds and Action
Position serves as a multiplier for other variables because late seats gain information unavailable to early actors. In multi-table formats, the button's value rises during high-blind stages when antes enter play, and this adjustment appears consistently across recorded sessions. Observers note that players who track their position relative to aggressive opponents adjust continuation bet frequencies more precisely than those who isolate position alone.
Blind Levels and Time Pressure
Blind structures dictate pace, yet their impact compounds when combined with payout jumps and remaining field size. Faster structures compress decision windows, leading to higher all-in frequencies documented in August 2026 series data. Slower structures allow greater exploitation of skill edges because players can accumulate information over more orbits, and this pattern holds across multiple regions tracked by independent tournament analysts.
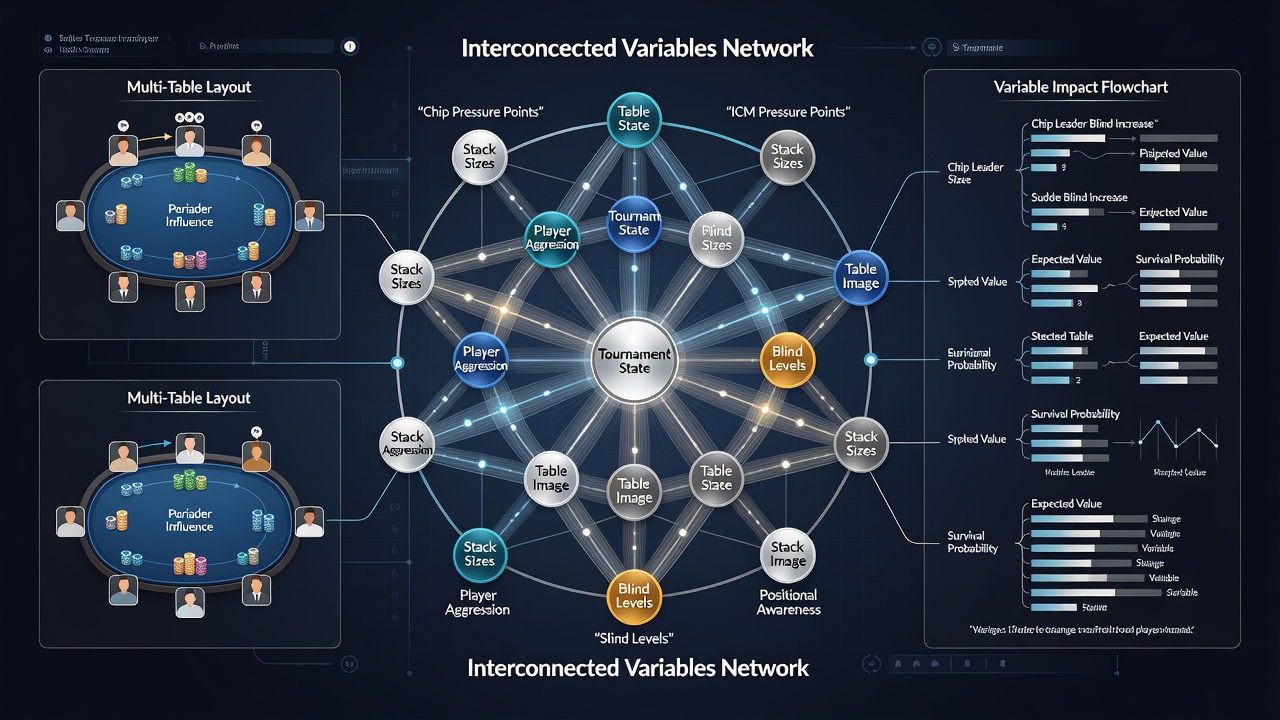
Player types add another layer because loose-passive opponents respond differently to rising blinds than tight-aggressive ones do. When these profiles cluster at the same table, the resulting dynamics shift expected values for marginal hands. Research from academic groups studying decision theory under uncertainty has quantified how opponent modeling accuracy improves when variables like remaining stack and position receive equal weight in real time.
Opponent Modeling and Table Dynamics
Table image forms through repeated actions, and this reputation variable intersects with all others because opponents adjust ranges based on observed history. Data from online platforms reveals that players tagged as tight receive more folds in late position during middle stages, whereas loose images force wider defenses that reduce fold equity for everyone involved. Those who update models continuously maintain edges that static approaches lose over long sessions.
ICM Pressure and Payout Structures
Independent Chip Model calculations grow relevant near money bubbles and final tables, where stack preservation sometimes outweighs chip accumulation. ICM pressure connects directly to blind levels because shorter stacks face elimination threats sooner, and this linkage appears in recorded final table statistics. Professional circuits report that participants who integrate ICM with position and stack data reach deeper runs more frequently than those who treat these factors separately.
Practical Tracking Approaches
Software tools now aggregate these variables into real-time dashboards, and adoption rates have risen steadily since 2024. Players input live data on stacks, positions, and opponent tendencies, then receive adjusted range recommendations that account for multiple overlaps. Tournament series held in August 2026 featured increased use of such systems, with results showing measurable differences in survival metrics compared to unaided play.
Conclusion
Multi-table tournament outcomes depend on networks of variables rather than isolated decisions, and available records confirm that systematic charting improves consistency across large samples. Position, stacks, blinds, and opponent profiles interact continuously, while external factors like payout structures add further connections. Continued data collection from regulated events worldwide supports ongoing refinement of these models without reliance on any single regulatory source.